Static Images
I developed a technique for creating this sort of image in 2007 while using a graphing calculator in Windows XP. I was graphing simple sine waves for the first ten partials of the harmonic series, with each partial in a different color. overlaying the resulting image on a cropped photograph of an electric bass neck yielded a map for finding the precise locations of harmonic nodes on an equal tempered fretboard.
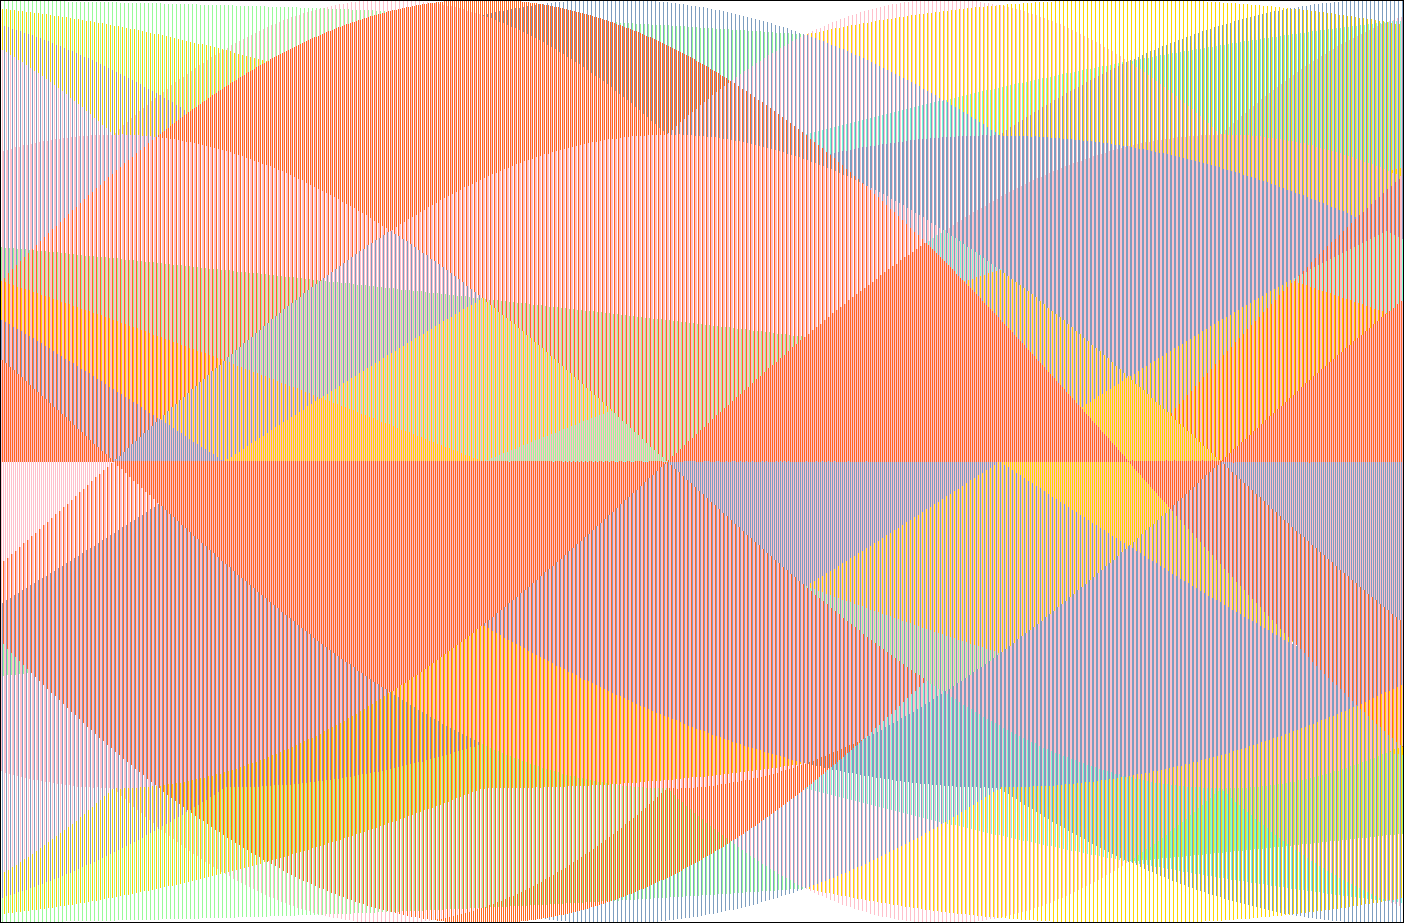
While I was dialing in the range of the sine wave graph I decided to experiment with very high values on the x axis. As the calculator struggled to render wavelengths far smaller than its pixel matrix would allow, very interesting patterns emerged. Some were chaotic, but a few were very pleasant wave forms. I learned to fine tune promising patterns and adjust the color schemes. The finished images were often reminiscent of the rolling hills of the Palouse where I was born.
All of the original run of these images are now lost, though a few small prints survive. I created this one in 2014 using an old XP machine running the same graphing calculator program as the originals. The image is made up of many vertical bars of solid color interacting to create regions of different color mixtures. It is particularly beautiful when viewed without antialiasing as a very large print or on a very large screen.

My friend Mu Sun wrote a python script generating an svg path describing a logarithmic spiral in the winter of 2012. I had planned to use this in a very ambitious project to plot the location of various natural cycles in musical octaves, but was not able to see the original vision into fruition. This is a rasterization of the output of his script tweaked to show an extremely tight spiral. It is a bit like staring directly into the sun.